Welcome to the world of real estate, where market trends, technology, and agent dynamics shape the landscape of property transactions.
In this comprehensive article, we present over 100 important realtor statistics for 2025, providing valuable insights into the industry’s key facets.

From market trends and homebuyer demographics to real estate technology adoption and investment strategies, these statistics offer a comprehensive snapshot of the real estate market today.
Explore the impact of digital marketing, the dynamics of home pricing and sales, the success rates of real estate agents, and the trends in sustainability.
Whether you’re a realtor, investor, or simply interested in the real estate industry, these statistics will provide you with a wealth of knowledge to navigate the ever-evolving world of real estate in 2025.
Real Estate Statistics By Generation
- 97 percent of homebuyers used the internet in their home search.
The widespread use of the Internet among homebuyers highlights the increasing reliance on digital resources in the real estate industry. With 97 percent of homebuyers utilizing the internet in their home search, it is evident that online platforms have become an essential tool for property research and exploration.
- 76 percent of homebuyers used a mobile or tablet search device in their home search, with Millennials (born between 1981 to 1996) using mobile devices nearly twice as often as the Silent Generation (born between 1928 to 1945.)
The dominance of mobile and tablet search devices in the home search process indicates the growing trend of on-the-go property browsing. It is interesting to note that younger Millennials are leading the way in mobile device usage, underscoring their familiarity and comfort with mobile technology compared to the Silent Generation.
- Younger Millennials conducted 65 percent of their mobile searches on mobile devices, while Baby Boomers (born between 1946 to 1964) conducted 75 percent on a desktop/laptop.
The contrasting search behavior between younger Millennials and older Boomers regarding mobile and desktop/laptop usage suggests a generational divide in preferred devices for home search. While younger Millennials gravitate towards mobile devices, older Boomers still prefer the traditional desktop or laptop experience when exploring real estate options.
- Buyers typically searched for eight weeks, viewing nine homes, five of which were viewed solely online.
The average duration of eight weeks spent by buyers in their home search signifies the significance of thorough research and evaluation. With buyers viewing an average of nine homes, including five online-only viewings, it is clear that virtual tours and online listings have become integral parts of the initial screening process before physically visiting properties.
- All generations except the Silent Generation were most likely to have first found the home they ultimately purchased online. At the same time, the Silent Generation were most likely to find their home first from their real estate agents.
The difference in the primary source of finding the ultimate home purchase between generations highlights the shifting landscape of home search methods. While all other generations prioritize online platforms as the initial discovery point, the Silent Generation still relies on their real estate agents to find their dream homes. This finding emphasizes the importance of personalized guidance for this particular demographic in the home-buying process.
6. 18 percent of Gen Zers (born between 1997 and 2003) were planning to purchase a home in the next 12 months as of June 2022, which was a sharp decrease from 21% in the quarter before.
As house prices and interest rates continue rising, the decrease in home buyer sentiment can be seen among all generation groups. This is especially true for younger generations who have not had as much time to acquire the money needed to purchase a home.
7. A significant portion of home buyers, specifically 14%, purchased multi-generational homes.
This decision was primarily motivated by the desire to care for and spend time with aging parents while also accommodating adult children over the age of 18 who were moving back home or for cost-saving purposes. Older Boomers ranked highest in this category, with 18% purchasing multi-generational homes, closely followed by Gen Xers at 17%.
- In 2022, Gen Xers emerged as the generation with the highest median household income, reaching $114,300. Following closely behind were the Older Millennials, with a median household income of $102,900.
- The Silent Generation claimed the highest proportion of married couples, with a notable 68% share.
- Among the various generations, Gen Z stood out with the highest percentage of single female buyers, accounting for 31%.
- Younger Millennials took the lead in unmarried couples, making up 20% of this category.
- Of all home buyers, 31% had children under the age of 18 residing in their homes.
- Among Older Millennials, an impressive 70% had at least one child under 18 living with them.
- When it comes to racial diversity, Gen Xers maintained their position as the most diverse group of home buyers in 2022. Among this generation, 23% identified as Hispanic/Latino, Black/African American, or Asian/Pacific Islander.
Top 10 Metros in the U.S. with the Fastest-Growing Sales Price
| Fort Lauderdale, FL | 16.1% |
| Myrtle Beach, SC | 15.4% |
| Fayetteville, NC | 14.7% |
| Boca Raton, FL | 13.8% |
| Hollywood, FL | 12.6% |
| Cleveland, OH | 12.2% |
| St. Louis, MO | 10.7% |
| Augusta-Richmond County, GA | 10.3% |
| Clearwater, FL | 9.1% |
| Lehigh Acres, FL | 7.9% |
Who is Your Average Realtor? 2023 Stats
The information below was found on the latest NAR information profile.
67% of REALTORS® are licensed as sales agents, 21% hold broker licenses, and 14% hold broker associate licenses.
The typical REALTOR® is a 56-year-old white female who attended college and is a homeowner.
66% of all REALTORS® are female, and the median age of all REALTORS® is 56.
Real-estate experience of all REALTORS® (median): 8 years
Most REALTORS® work 35 hours per week.
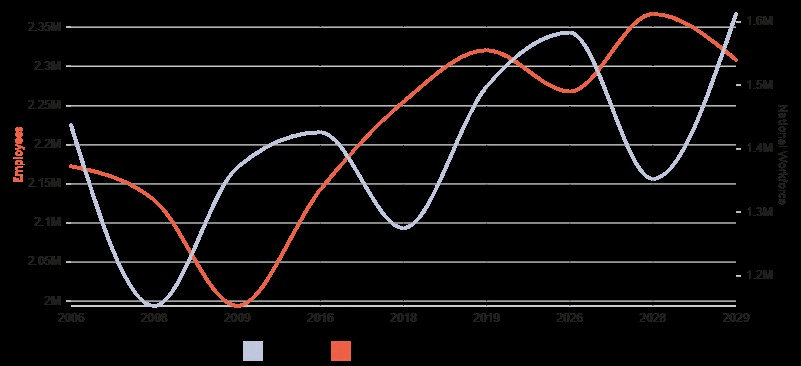
Projected Job Growth – 10-Year Projection

Online Realtor Statistics for 2023
Looking for more real estate statistics? Check out these trending topics.
Online Listing Photos
High-quality listing photos are crucial for attracting potential buyers. According to the NAR, 87% of home buyers found photos to be the most useful feature on real estate websites.
Property Information
Buyers rely heavily on online platforms to gather information about properties. The NAR found that 42% of buyers looked for information on property listings, such as the price, detailed property description, and neighborhood details.
Home Buyers’ Online Activities
The NAR reported that 77% of home buyers drove by or viewed a home they found online, and 63% of buyers walked through a home they found online.
Real Estate Video Content
Videos have become increasingly popular in real estate marketing. According to the NAR, 53% of home buyers found virtual tours and videos to be very useful during their home search.
Online Mortgage Rate Comparisons
Many buyers compare mortgage rates online before deciding on a lender. The NAR reported that 82% of buyers considered mortgage rates to be important in their home-buying process.
Online Home Valuations
Homeowners and buyers often use online tools to estimate the value of a property. In a NAR survey, 44% of sellers and 62% of buyers reported that they found online home valuations to be very important.
Online Real Estate Advertising
Digital advertising has gained prominence in the real estate industry. In 2019, the NAR found that 46% of realtors used social media advertising, and 45% used display/banner advertising to market their listings.
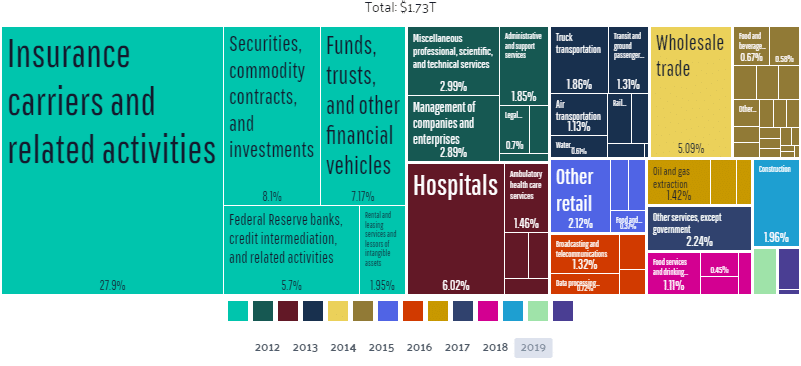
Use of Output by Other Industries

Image provided by Data USA: Real Estate
Real Estate Firm Technology Use Statistics
- The most frequently provided or encouraged software tools by firms are e-signature (83%), comparative market analysis (82%), electronic contracts/forms (80%), and multiple listing (79%).
- 41 percent of firms consider keeping up with technology as a challenge.
- 96 percent of REALTORS® use a smartphone with wireless email and internet capabilities on a daily basis.
- 95 percent of REALTORS® use email daily, and 57 percent use social media apps daily.
- 69 percent of members have a website, and their sites are typically five years old.
- Less than half of survey respondents said their firm paid for their real estate website.
- When communicating with clients, REALTORS® most often prefer text messaging (93%), followed by telephone (90%), and e-mail (89%).
- 56% of REALTORS® are using drones within their business.
Social Media and Tech Trends:
- Although more than half of REALTORS® report using social media, only 18% say they enjoy it.
- More than half of REALTORS® say they have a social media presence because they’re expected to.
- 49% believe social media helps them build and maintain relationships with clients and use it for listings.
- The top three tech tools that provide REALTORS® with quality leads are social media (52%), Customer Relationship Management (31%), and MLS sites (28%).
- Looking ahead, REALTORS® believe they will use eSignature the most in the next 12 months (73%), followed by social media (53%) and local MLS apps & technology (47%).
- 90 percent of REALTORS® use Facebook, followed by 52 percent on Instagram and 48 percent on LinkedIn.
- The most desired tech tool not currently offered by members’ brokerages is cyber security, followed by lead generation and eNotary.
Online Rental Statistics
- 9.2 million leases are executed yearly, while 6.9 million homes are sold.
- 81% of renters indicate they hope to own a home someday.
- 57% of renters cannot afford a home.
- Trulia, once Zillow’s greatest rival, is now a Zillow brand with 21.66 million unique visitors each month.
- HotPads has 3.29 million unique visitors per month.
- Acquisitions Streeteasy and NakedApartments are exclusive to New York City.
- OutEast caters to upscale prospective second home-buyers in the Hamptons.
A Look Back: Real Estate Statistics for 2022
These statistics were pulled from the 2022 Housing Market Year in Review presented by Redfin.
- Home prices rose to an all-time high, reaching $430,365 in May of 2022.
- San Francisco was the most expensive metro area for homebuyers, with a median sale price of $1,505,000.
- Detroit was the least expensive metro area for homebuyers, with a median sale price of $165,000.
- Rent prices rose dramatically, with the nationwide median rent price reaching $2,053 in August.
- Homebuyers looking to relocate favored Sun-Belt cities like Miami, Tampa, Las Vegas, and Phoenix.
- Inflation rose at a record pace, reaching 6.48% in November.
- Mortgage rates climbed to nearly 7%, the highest since 2002.
- Housing inventory rose after hitting a record low, with 10.7 million homes listed for sale through November.
- Months of supply dropped to a near-record low of just 1.2 months.
- New construction took up a growing share of housing inventory, with 1.25 million privately-owned new homes built.
- Home sales fell nearly 17% year over year, with 5.62 million homes sold through November.
- Median days on the market rose to 24 days, an 8.4% increase compared to 2021.
- 14% of active home listings experienced price drops, with 22.6% of listings having price drops in October.
- 55% of homes had a bidding war, down from 64% in 2021.
- Over 30% of homes were purchased with cash.
- Real estate investors purchased nearly 20% of available listings, a new record.
- Luxury home sales experienced their biggest year-over-year decline on record, with 27% fewer sales in 2022.
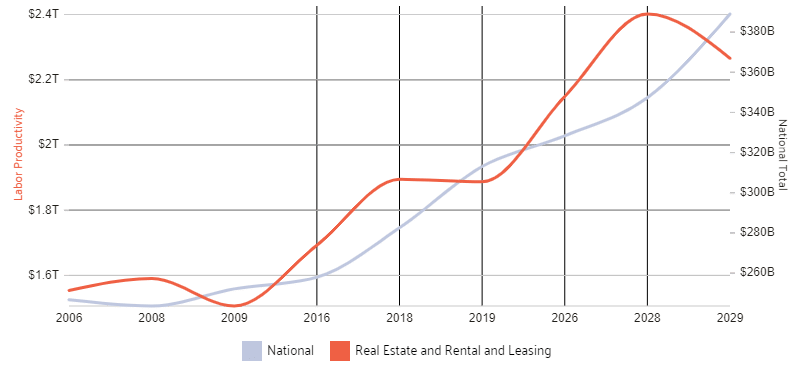
This line chart shows the projected 10-year growth in output of the Real Estate and Rental and Leasing industry.
Data from the Bureau of Labor Statistics BLS Statistics by Industry, Growth.

More Real Estate Statistics
These statistics were provided by Fits Small Business and shed light on the state of the industry, housing trends, and regional variations, empowering industry professionals to make informed decisions and adapt their strategies to the current market conditions.
- The rise in the US homeownership rate to 66% in September 2022 indicates increased affordability and social stability for individuals and families.
- The Midwest boasts the highest homeownership rate in the US at 70.1%, making it an ideal region for real estate professionals to establish their careers.
- In the third quarter of 2022, 79.5% of individuals aged 65 years and over owned homes, highlighting the strong homeownership among senior citizens.
- First-time homebuyers made up 26% of the market in 2022, suggesting challenges for younger generations in saving for their first homes.
- 47% of homebuyers prefer to search online before contacting an agent, underscoring the importance of a strong online presence for real estate professionals.
- Home sellers commonly sell their homes to move closer to friends and family, accounting for 21% of the reasons behind property sales.
- In December 2022, there were 54.7% more houses for sale compared to the previous year, providing homebuyers with increased options.
- US existing home sales fell by 1.5% in December 2022, reflecting a decline in activity and potential challenges for homebuyers.
- FSBO transactions accounted for 10% of recent home sales, highlighting a small but significant segment of the market.
- In December 2022, 376,319 homes were sold, indicating the level of activity in the housing market during that month.
- May 2022 recorded an all-time high home sale price of $432,877, showcasing the impact of high demand and limited supply on property prices.
Real Estate Data
- The median sale price of single-family homes in December 2022 was $372,700, reflecting the continued challenges for homebuyers due to limited inventory and high mortgage rates.
- Homes were typically sold in a median of 37 days in December 2022, suggesting a slower pace in the housing market during that period.
- Birmingham, AL, experienced the fastest-growing sales price at 24%, making it a potentially profitable market for real estate professionals that perform well thanks to online real estate schools.
- Fayetteville, NC, emerged as the most competitive city in the US, highlighting high demand and increased competition for buyers in that area.
- San Francisco retained its position as the most expensive metro area in 2022, indicating a market with high property values and the potential for substantial returns.
- Detroit stood out as the most affordable metro area for homebuyers, providing more affordable options compared to national averages.
- Mortgage rates fell to 6.15% (30-Yr FRM) and 5.28% (15-Yr FRM) in January 2023, presenting improved borrowing conditions for potential homebuyers.
- In December 2022, 1,382,000 new housing units were started, reflecting the level of construction activity and potential future housing supply.
Commercial Real Estate Outlook from Deloitte 2023
The information listed below comes from Deloitte’s 2023 Commercial Real Estate Outlook. From revenue expectations and real estate fundamentals to ESG compliance, tax regulation trends, employee expectations, and technology spending, these highlights provide insights to guide your strategic planning in the ever-evolving world of commercial real estate in 2025 and beyond.
- Revenue expectations for 2023: 40% expect an increase, 48% expect a decrease, and 12% expect no change.
- Real estate fundamentals: 66% of respondents expect improving or stable conditions for the cost of capital, capital availability, property prices, vacancy levels, leasing activity, transaction activity, and rental rates.
- ESG compliance and reporting: Only 12% of respondents are prepared to immediately implement changes to meet new regulatory real estate requirements, and 7% use ESG data and analytics in their investment strategy decision-making.
Sources:
